Difference: ResultsWinter2016SM (r2 vs. r1)

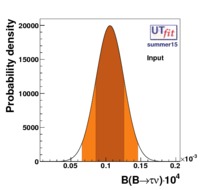
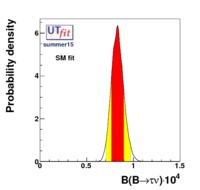
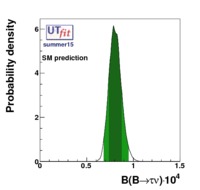
Standard Model Fit results: Summer 2015


Fit Input for \,B(B\rightarrow\tau\nu)\cdot 10^{4}
Gaussian likelihood used
1.06 \pm 0.20

EPS - PDF - PNG - JPG - GIF


Full Fit result for \,B(B\rightarrow\tau\nu)\cdot 10^{4}
0.830 \pm 0.064
95% prob:[0.705, 0.968]
99% prob:[0.652, 1.045]
EPS - PDF - PNG - JPG - GIF


SM Fit prediction for \,B(B\rightarrow\tau\nu)\cdot 10^{4}
0.805 \pm 0.066
95% prob:[0.677, 0.939]
99% prob:[0.623, 1.022]
EPS - PDF - PNG - JPG - GIF


Compatibility Plot for \,B(B\rightarrow\tau\nu)\cdot 10^{4}
0.805 \cdot \times
EPS - PDF - PNG - JPG - GIF

View topic | View difference side by side | History: r3 < r2 < r1 | More topic actions
 
  Powered by
Foswiki
Ideas, requests, problems regarding this web site? Send feedback