
[EPS format] [JPG format]
|
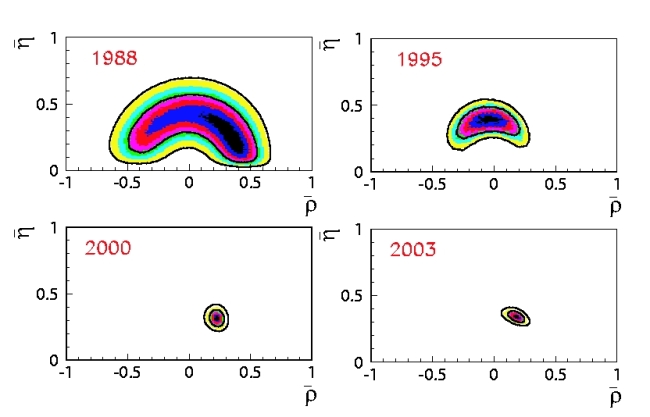
From left to right, they correspond to the following papers:
The dotted lines correspond to the 95% C.L. regions (the only information given in those papers). The larger bands (from year '99) correspond to values
of  from direct measurements. from direct measurements.
|
predictions
predictions
predictions
plane (contours at 68% and 95% probability are indicated by continuous black curves).

 Ideas, requests, problems regarding this web site? Send feedback